


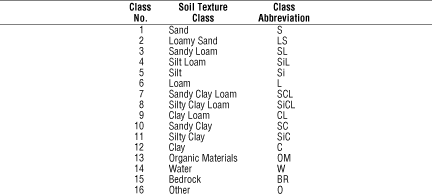
The dominant soil texture class for each map unit was determined from the STATSGO Component and Layer tables for each state. For each layer within a component the Texture1 variable contains the rock fragment and texture class information in a combined description (e.g. "extremely cobbly-sandy loam").
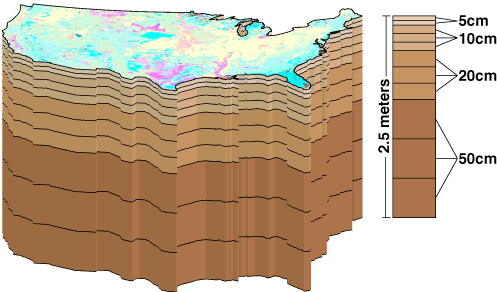
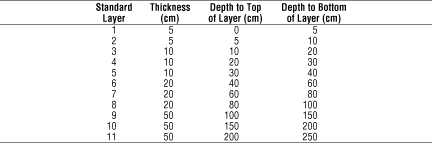
However, the number, thickness, and depth to top and bottom of soil layers in the STATSGO data varies widely from one soil component to another, even within the same map unit. The wide variation of layer definitions makes it difficult to use the STATSGO data in models, especially if they require rasterized (gridded) data. To facilitate rasterization of the STATSGO data and the physical and hydraulic properties derived from them, we converted the STATSGO layers to a set of 11 standard layers.
For each component in a given map unit, the layers reported in the Layer table for the component were compared with each standard layer. If the standard layer was entirely included within one of the component layers, the texture class associated with the Texture1 value (which specifies the dominant soil texture and rock fragment class for the component layer) was multiplied by the Comppct value (percentage of map unit covered by the component) to determine the fractional contribution of the texture class to the standard layer. If the standard layer overlapped two or more component layers, the Texture1 values of each component layer were first weighted in proportion to the amount of overlap before multiplication by the Comppct value. After all components for the map unit were processed, the texture class for which the total fractional contributions from all components in the map unit was largest was determined for each standard layer and entered as the dominant texture class for that layer.
Many Component table entries for depth to bedrock used 60 inches (1.5 m) to indicate that bedrock was not encountered within this distance of the surface. In many cases, the layer table for such a component included a non-rock layer extending below the specified maximum depth to bedrock. When the Layer table did contain layers extending below the depth to bedrock reported for the component, these layers were used, and the bedrock was assumed to actually start immediately below the deepest such layer. When the bottom of the deepest layer was above the reported bedrock, the bottom layer was extended to the bedrock depth or the bottom of the deepest standard layer (2.5 m), whichever was less. The standard layers are as follows:
The table below lists the texture classes and their assigned numerical codes in the multi-layer soil characteristics data set. Water, organic materials (peat, muck, etc.) and other non-soil surface bedrock cannot be placed in one of the 12 soil texture classes. These classes have been combined into "water", "organic", and "other" and are also given. Including these classes in the final data product provides maximum flexibility to the modeler for making decisions with regard to the use of the dataset. Additional lookup tables may be used to interpret these classes or re-classification functions found within standard GIS software environments can easily aggregate the listed classes.
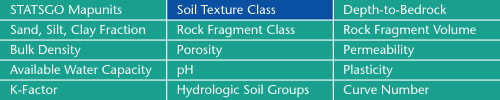
Sand, Silt, Clay Fractions | Rock Fragment Class | Rock Fragment Volume
Bulk Density | Porosity | Permeability
Available Water Capacity | pH | Plasticity
K-Factor | Hydrologic Soil Groups | Curve Numbers
Soil Landscapes | Soil Climates | Soil Datasets | Personnel | Site Map
Comments and Questions
4/19/99